
How to Use Our Meta Sheets


BaronSteal's meta sheets are designed to give you a quick snapshot of what’s actually performing in the current ranked meta - separated by rank, role, and champion performance trends.
Unlike traditional tier lists that rely primarily on win rate, BaronSteal combines multiple public data sources and evaluates champion performance using several metrics - including Win Rate, Win Delta, Pick/Ban Influence (PBI), and sample size - to surface champions that are consistently strong in each ranked bracket.
If you’re newer to League analytics, don’t worry: the goal isn’t to drown you in stats. It’s to help you understand what’s strong, what’s overrated, and what might be flying under the radar.
Last update: 9/29/26
Workbook Structure
Every workbook is broken out by rank because the meta changes depending on skill level.
A champion that dominates in Bronze may struggle in Diamond. A high-skill champion that underperforms in lower ranks may become incredibly strong once players can execute them properly. That means...
• Don’t assume low-ELO win rate = universally strong
• Always use the sheet that matches the games you actually play

This is your fastest snapshot of the rank’s overall meta.
It strips away extra clutter and focuses on the key signals:
Champion
The champion being measured.
Win Rate
How often that champion wins games in this data sample.
A higher win rate usually suggests stronger performance - but win rate alone doesn’t tell the whole story.
For example:
• Some win because only specialists play them
• Some have average win rate but are still dominant because of high presence
Games
The total number of games included in the sample.
This helps tell you whether a result is statistically meaningful.
Examples:
More games usually means the data is more stable.
Win Delta
This shows how a champion is performing relative to expectation.
Think of it like:
“Is this champion outperforming what the field says they should be doing?”
A champion with:
This helps catch hidden strengths or weaknesses that raw WR can miss.

These tabs go deeper into each role and add another layer of context.
Instead of just showing what wins, they help identify why a pick may matter.
PBI (Pick Ban Influence)
PBI measures how influential a champion is in the current meta.
- (WinRate) The champion's current win percentage.
- (AvgWinTier) The average win rate of all champions in that specific tier.
- (PickRate) The percentage of games in which the champion is picked.
- (BanRate) The percentage of games in which the champion is banned.

Rather than looking at win rate alone, PBI estimates how heavily a champion impacts ranked play overall.
In simple terms, it helps answer:
“How much does this champion shape the current meta?”

To make the sheet easier to scan, champions are grouped visually based on performance trends.
Green = Top Performers
These are the Top 5 champions by win rate in that sheet.
That does not automatically mean they are the best blind picks - but they are currently converting wins at the highest rate in this sample.
Use this as: potential priority picks to review, strong patch performers, and a quick “what’s winning” reference
Blue = Rising / Sneaky Strong
These are some of the most valuable picks in the workbook.
These champions usually combine: lower overall pick presence, positive Win Delta, and a strong win rate.
In other words: “This champion may be stronger than public perception suggests.”
These could be: patch winners people haven’t fully adapted to yet, underplayed strong champions, sleeper picks.
Red = Falling / Weak
These champions are currently showing warning signs.
Usually things like: performance below the field, negative Win Delta, and a poor win rate.
That doesn’t mean they’re “unplayable.”
It often means: the current patch may not favor them, they may be overpicked despite weak results, they may require specialist skill.

Meta data is a tool - not a substitute for champion mastery.
A statistically strong champion you can’t play is often worse than a comfort pick you execute well.
Use these sheets to:
- spot trends
- understand patch shifts
- identify hidden strength
- make smarter champion decisions
But always filter the data through your own skill, champion pool, and rank environment.

The BaronSteal Meta Sheets are designed for any League of Legends player who wants to make smarter champion picks using objective, data-driven insights. Whether you're climbing out of Iron or competing in Master+, each sheet is tailored to the strengths and weaknesses of that specific ranked bracket so you can make decisions based on the meta you're actually playing in.
These rankings are especially useful if you:
- Want to climb ranked faster by focusing on champions that consistently perform well in your elo.
- Are building or refining a champion pool and want to prioritize reliable picks over short-lived trends.
- Play multiple roles and need to quickly compare which champions are performing best in each position.
- One-trick or main a champion and want to understand how it stacks up against the current ranked meta.
- Prefer data over opinions, using real performance metrics instead of subjective tier lists.
No tier list can replace game knowledge, champion mastery, or good decision-making, but choosing champions that are consistently succeeding in your rank can help remove unnecessary variables while you focus on improving.
Our goal is to provide a clear, unbiased view of the current League of Legends meta so you can spend less time searching through statistics and more time winning games.

One of the biggest mistakes players make is assuming the same champion is equally strong at every skill level. In reality, the League of Legends meta changes significantly from one rank to another as player mechanics, game knowledge, and team coordination improve.
Champions that dominate in Iron or Bronze may become far less effective in higher ranks where opponents are better at punishing mistakes. Likewise, some champions that struggle in lower elo can become incredibly powerful in Diamond or Master+ once players have the mechanics and game knowledge to unlock their full potential.
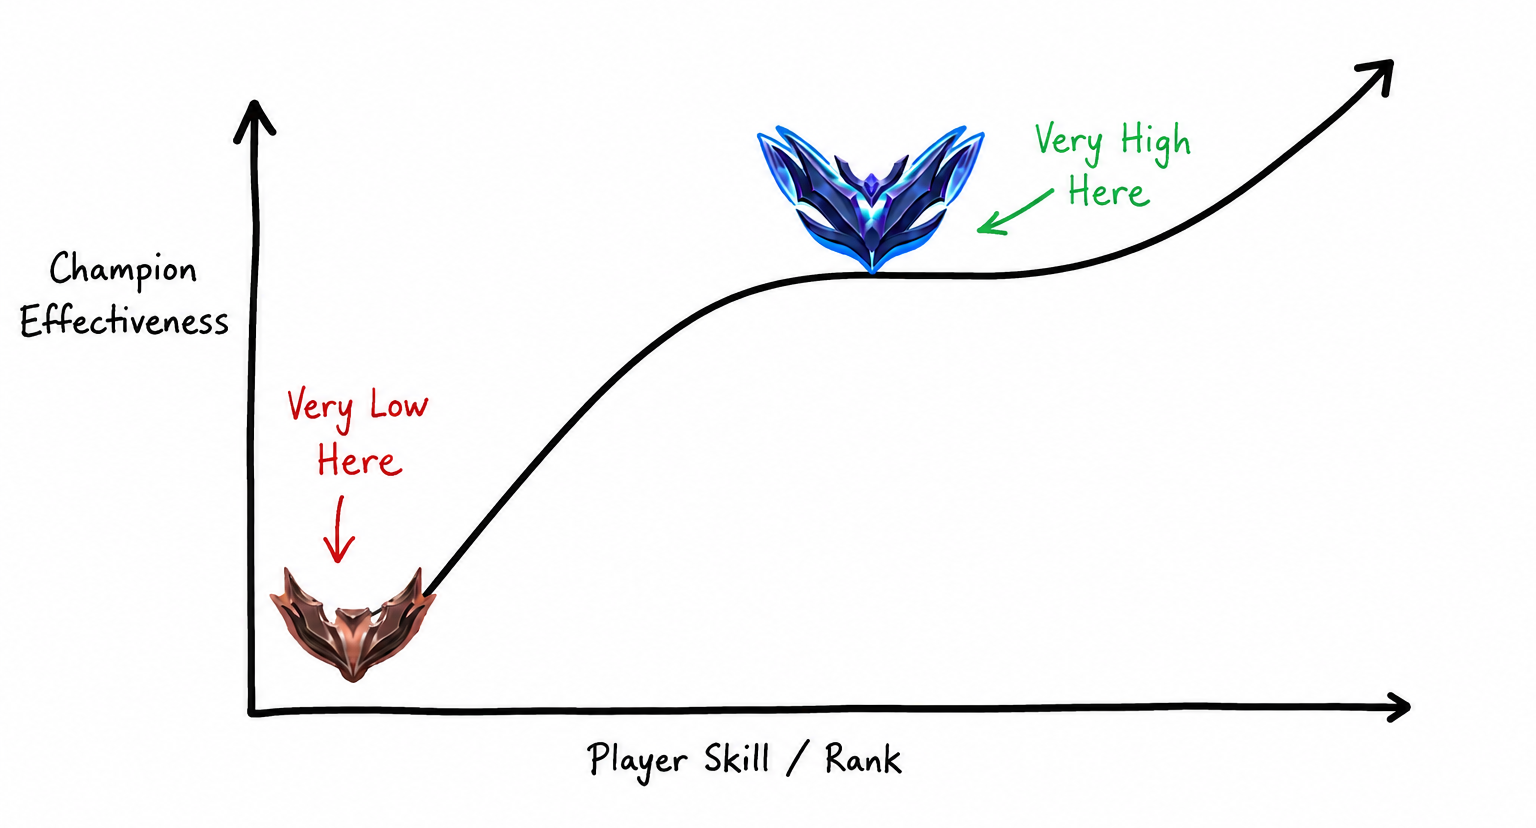
That's why we separate every ranked meta sheet by individual rank instead of creating a single universal tier list. Each sheet is built using data collected specifically from that ranked bracket, helping you identify the champions that are consistently performing well against players at your current skill level.
Whether you're looking for the best champions to climb with in Silver, searching for the strongest Diamond picks, or preparing for Master+ games, using rank-specific data gives you a more accurate picture of the current meta than a one-size-fits-all tier list.

How often are the BaronSteal Meta Sheets updated?
The BaronSteal Meta Sheets are updated approximately seven days after every major League of Legends patch. Waiting one week allows enough ranked games to be played for the data to stabilize, resulting in more accurate and reliable champion rankings.
What data is used to rank champions?
Our rankings combine multiple publicly available data sources and evaluate champions using several performance metrics, including Win Rate, Win Delta, Pick/Ban Influence (PBI), and sample size. This provides a more complete picture than relying on win rate alone.
Why doesn't BaronSteal rank champions by win rate alone?
Win rate is an important metric, but it doesn't tell the whole story. Some champions have inflated win rates because of low pick rates or favorable matchups. BaronSteal considers multiple performance indicators to identify champions that consistently perform well across a larger set of ranked games.
Why are there separate meta sheets for each rank?
Champion strength changes significantly between skill levels. A champion that performs well in Iron may not be as effective in Diamond or Master+, where player mechanics, game knowledge, and team coordination are very different. That's why each BaronSteal Meta Sheet is built using data collected specifically from that ranked bracket.
Can I use a higher-rank meta sheet to improve faster?
Generally, you'll get the most accurate recommendations by using the meta sheet for your current rank. Since each sheet reflects the champions that perform best against players of similar skill, it provides a more realistic view of the meta you'll encounter while climbing.
Are the BaronSteal Meta Sheets opinion-based?
No. While every ranking system requires methodology, BaronSteal's Meta Sheets are built using objective performance data collected from multiple public statistics sources. Our goal is to provide consistent, data-driven rankings rather than subjective tier lists.

Looking for the latest champion rankings in your current elo? Explore our rank-specific League of Legends meta sheets, updated after every patch.



Join the Discussion